Overview
KPG View is an interactive visualization tool for exploring power-grid simulation results on a map. It helps you quickly understand where key behaviors happen in the network (flows, voltage levels, generator locations, load hotspots) and to compare scenarios by turning layers on/off, filtering, and highlighting components.
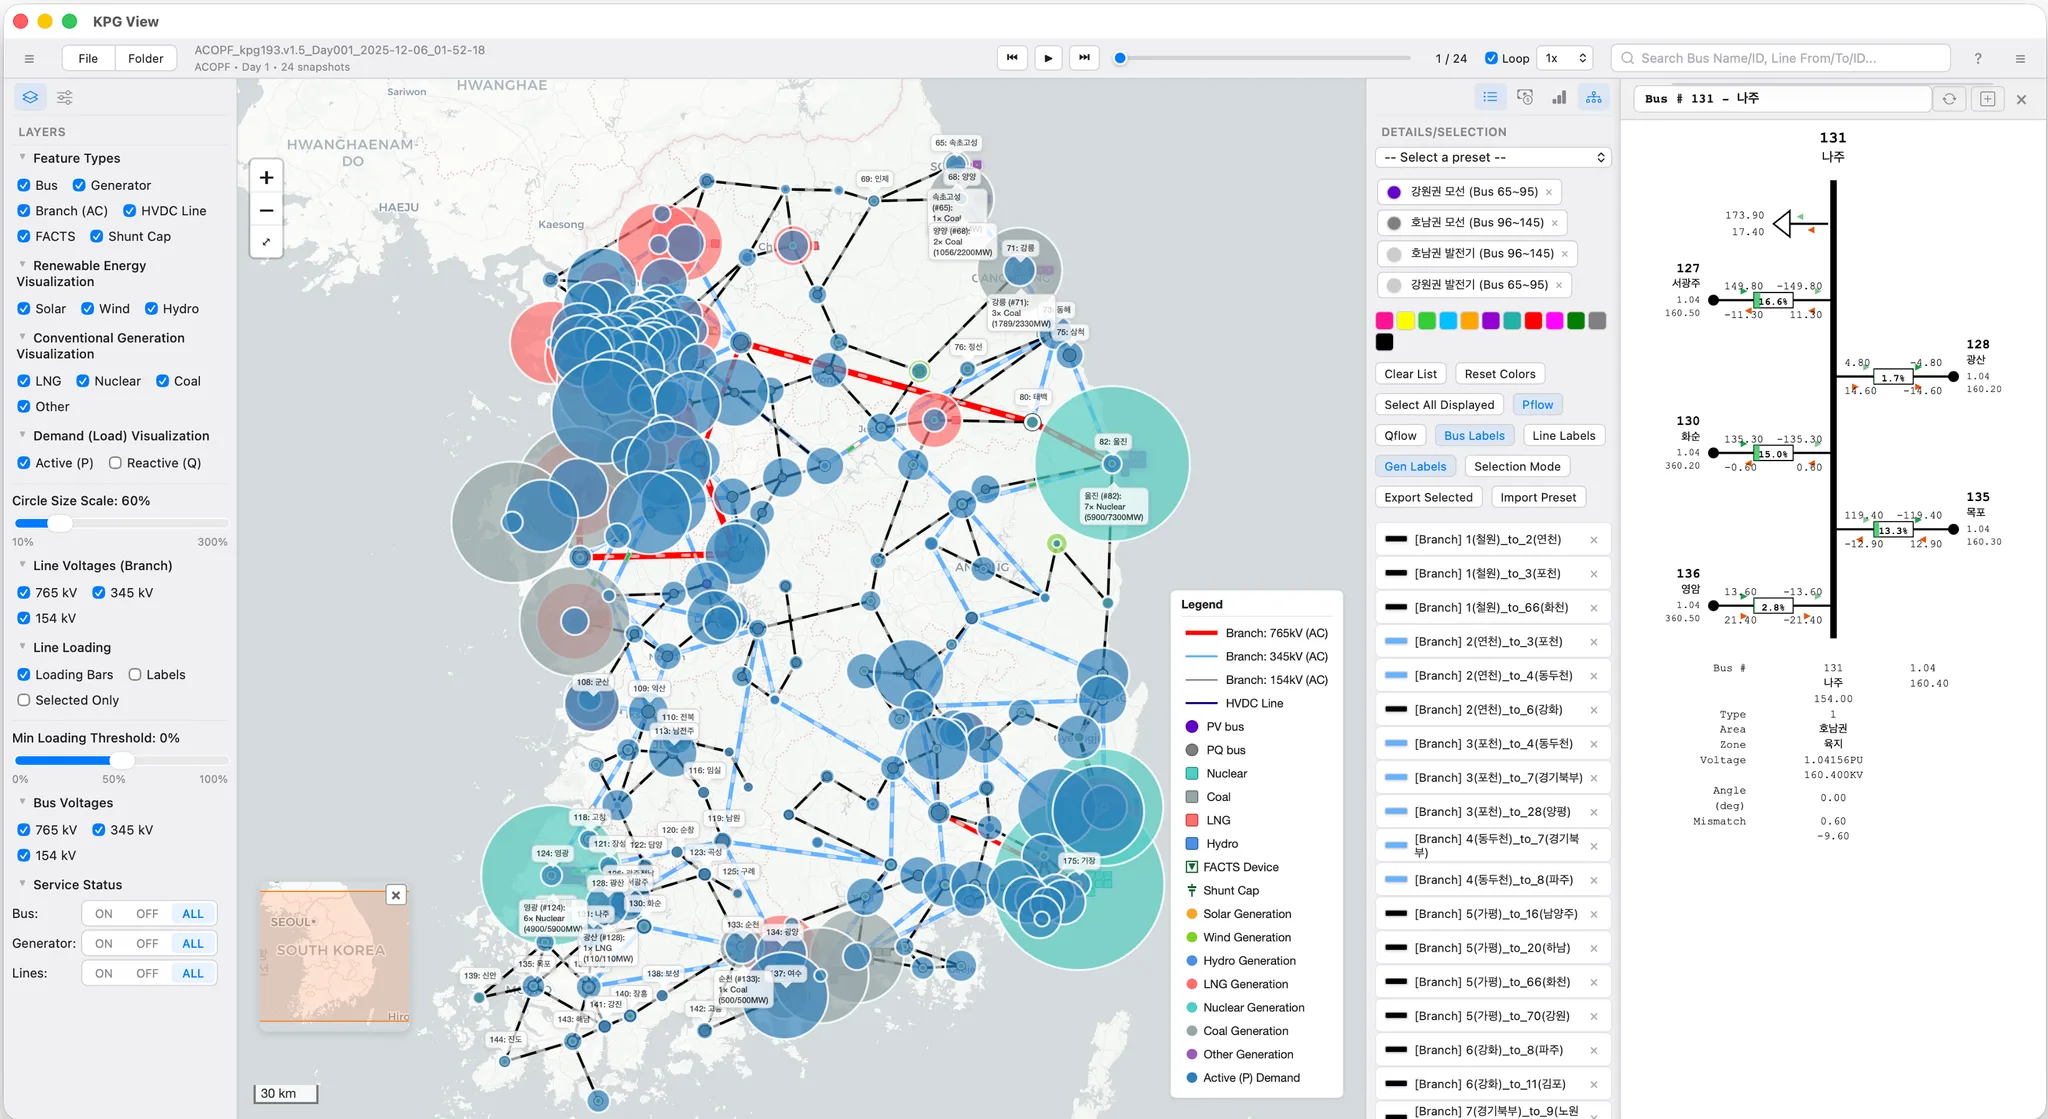
Key capabilities:
Layer-based visualization: Bus / Generator / Branch (AC) / HVDC / FACTS
System overlays: renewable & conventional generation, system load (P/Q), and line flows (Pflow/Qflow)
Filtering & focus: voltage level (e.g., 765/345/154 kV), service status (ON/OFF), generator fuel type
Selection workflow: search by bus/line IDs, highlight with colors, label buses/lines/generators
Shareable analysis: presets and export of selected elements for reports and follow-up studies