Back to Research
Dynamic Line RatingForecastingGrid ModernizationAI for EnergyGraph Neural Networks
Dynamic Line Rating — Part 1: AI-Powered Forecasting
10 MinAGM Center Research Team
How AI reveals hidden transmission capacity by forecasting dynamic line ratings across the entire grid.
🌤️ Dynamic Line Rating — Part 1: AI-Powered Forecasting
A simple guide to how AI predicts transmission line capacity.
🔍 Why Do We Need Dynamic Line Rating?
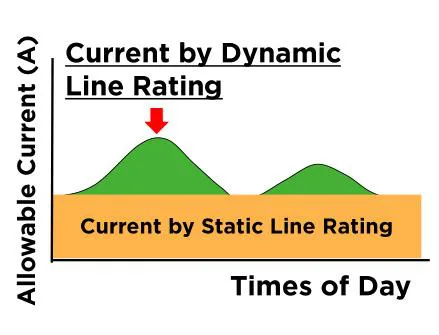
Figure 1. Difference between dynamic line rating (DLR; green) and static line rating (SLR; orange). DLR unlocks additional capacity compared to traditional SLR. (Image source: Sumitomo Electric)
Transmission lines are traditionally operated using Static Line Ratings (SLR) —
conservative, fixed capacity limits based on worst-case weather (high temperature, low wind).
But real weather is rarely “worst case,” which means:
We underuse existing transmission lines
Renewable power gets curtailed
System costs increase unnecessarily
In reality, many lines could safely carry more power at certain times, especially on cooler or windier days.
This is the motivation behind Dynamic Line Rating (DLR) —
adjusting line limits based on real-time weather.
However, to use DLR safely, we must first predict how much capacity a line will have in the future.
😨 Why Forecasting DLR Is Hard
DLR depends on rapidly changing weather conditions:
Wind speed & direction
Ambient temperature
Solar radiation
Local terrain & microclimates
Thus, traditional DLR forecasting methods face three limitations:
1) Weather uncertainty
Deterministic forecasts often miss sudden changes.
2) No sense of uncertainty
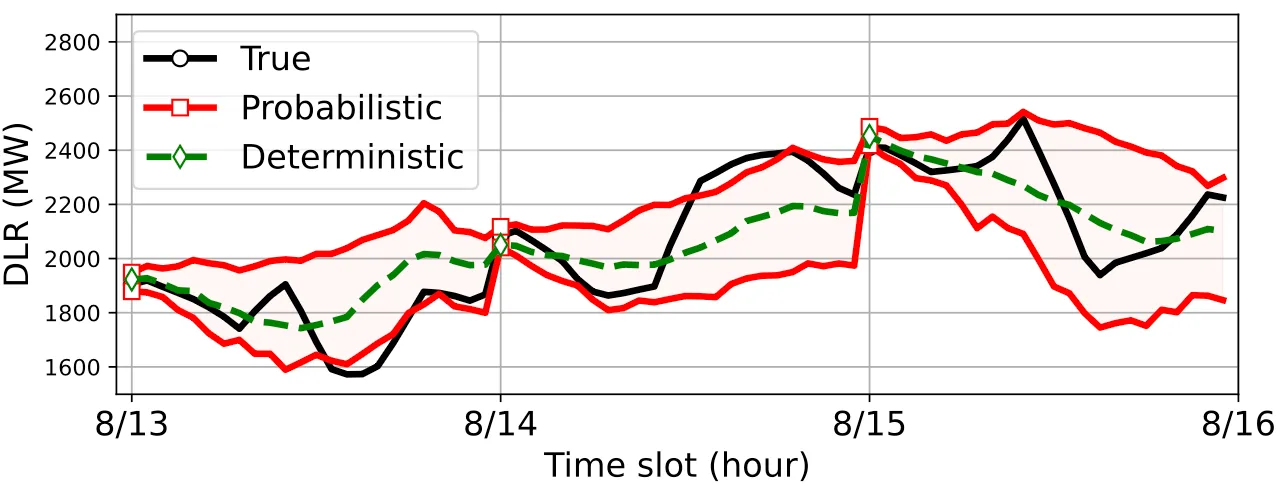
Figure 2. Example of probabilistic forecasting (red) compared to deterministic forecasting (green).
As shown in Fig.2, Deterministic forecasting gives only a single value, offering no sense of uncertainty.
Operators, however, need safety margins, not point estimates.
Probabilistic forecasting provides a prediction interval, showing both the expected rating and how uncertain it is—making grid operation safer and more informed.
3) No network-wide awareness
Most models treat lines independently, ignoring interactions across the grid.
Accurate DLR forecasting requires spatial information because nearby transmission lines experience similar weather patterns.
🤖 Introducing LGCLSTM
A network-aware, AI-powered probabilistic DLR forecasting model.
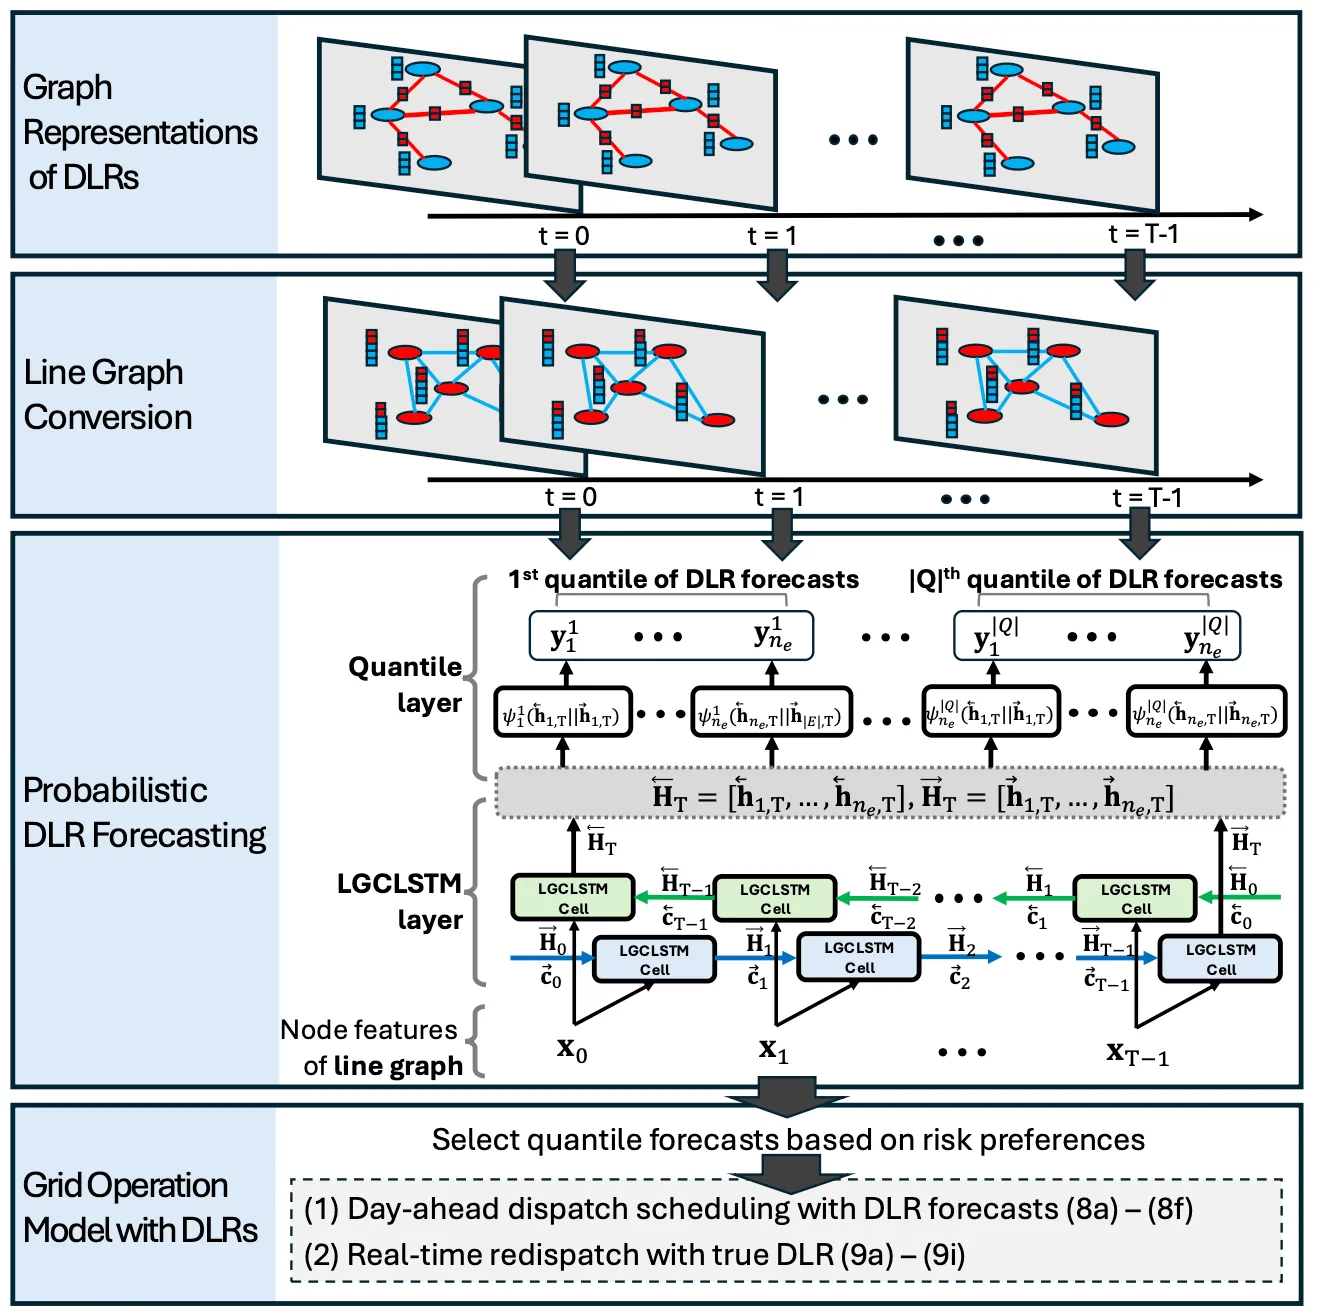
Figure 3. Overall framework for probabilistic DLR forecasting including LGCLSTM.
LGCLSTM stands for **Line Graph Convolutional LSTM**, and it improves DLR forecasting in three important ways:
1️⃣ It sees the grid as a network, not isolated lines
LGCLSTM converts the transmission system into a line graph, where:
Each line becomes a “node”
Lines that share a bus become neighbors
This allows the model to learn how weather and loading patterns propagate across the grid.
2️⃣ It learns how DLR changes over time
DLR is highly temporal.
LSTM helps the model remember patterns such as:
Daily temperature cycles
Seasonal effects
Sudden drops due to storms
3️⃣ It predicts probabilistic ranges, not single values
Instead of outputting a single limit like:
“Line 109 tomorrow: 2200 MW”
LGCLSTM outputs intervals such as:
80% confidence: 2030–2280 MW
90% confidence: 1980–2330 MW
98% confidence: 1850–2440 MW
Operators can choose:
Aggressive operation → lower quantile
Safe operation → higher quantile
📈 What Did LGCLSTM Achieve?
Tested on the Texas 123-bus backbone system using five years of weather data, LGCLSTM demonstrated:
✔ Best overall performance in probabilistic forecasting
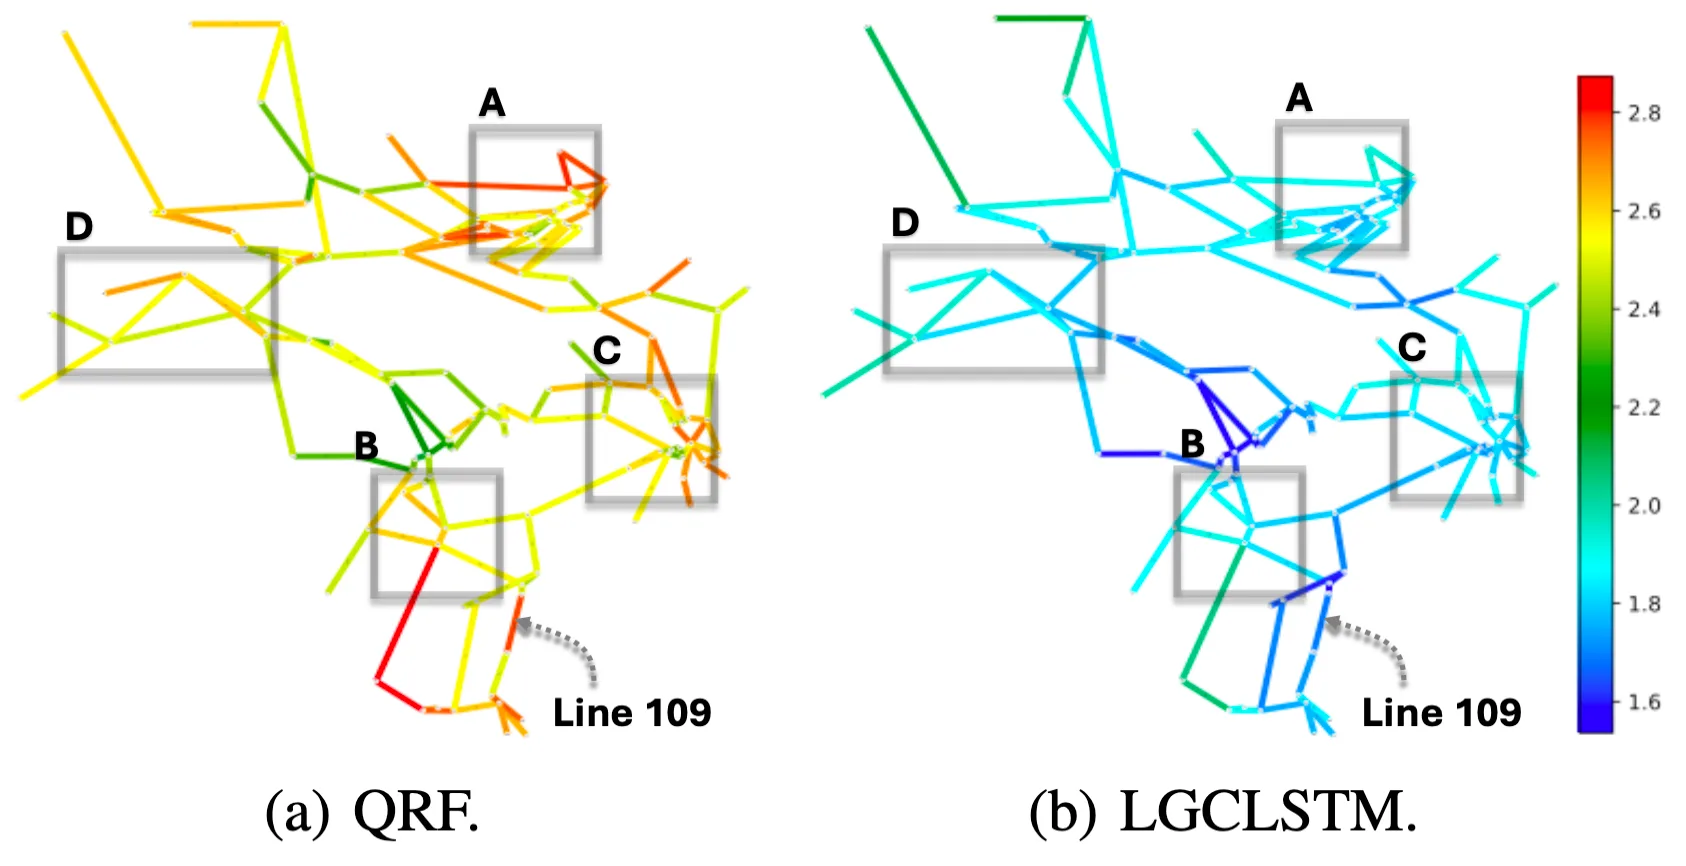
Figure 4. Heat maps of the average quantile score for each line in 2021 across TX-123BT (ERCOT). The gray dotted arrow points the line #109 where the highest differnce in the score between QRF and LGSLCTM is observed.
Red = worse, blue = better;
QRF struggles in dense regions (A–D) due to no spatial modeling, while LGCLSTM greatly improves performance!
✔ Lower operating costs when used in OPF
When LGCLSTM forecasts were integrated into day-ahead and real-time grid operation:
Total system cost was the lowest among all methods
Renewable curtailment was reduced
Redispatch cost was minimized
This shows that better forecasts lead to better decisions.
💡 Why This Matters for Grid Operators
Accurate DLR forecasting unlocks hidden grid capacity, enabling:
✔ More renewable integration
✔ Lower congestion & redispatch costs
✔ Greater situational awareness
✔ Risk-aware dispatch decisions
✔ Better use of existing infrastructure without new transmission
DLR is a powerful tool, and LGCLSTM makes its adoption more reliable and practical.
🔗 What Comes Next: Part 2
Forecasting is only half the story.
Even if a line can carry more power today,
should it?
Overheating accelerates conductor aging, leading to expensive replacements and long-term reliability risks.
In Part 2, we explore:
👉 Dynamic Line Rating — Part 2: Conductor Health-Aware Operation
How to use DLR safely by incorporating conductor degradation into unit commitment decisions.
📘 Reference
Kim, Minsoo, Vladimir Dvorkin, and Jip Kim. "Probabilistic Dynamic Line Rating with Line Graph Convolutional LSTM." arXiv preprint arXiv:2512.04369 (2025). [link]