Introduction
Introduction to KPG Platform
KPG (Korean Power Grid) Platform is the modeling platform developed at the AGM Center for advanced power system analysis, electricity market studies, and collaborative research.
The KPG Platform consists of three integrated modules that work together to provide a complete workflow from data to analysis to visualization.
Three Core Modules
flowchart LR
    A["🗺️ KPG Test System (Synthetic Grid Data)"] --> B["⚡ KPG Run (Optimization)"]
    B --> C["📊 KPG View (Visualization)"]
🗺️ KPG Test System
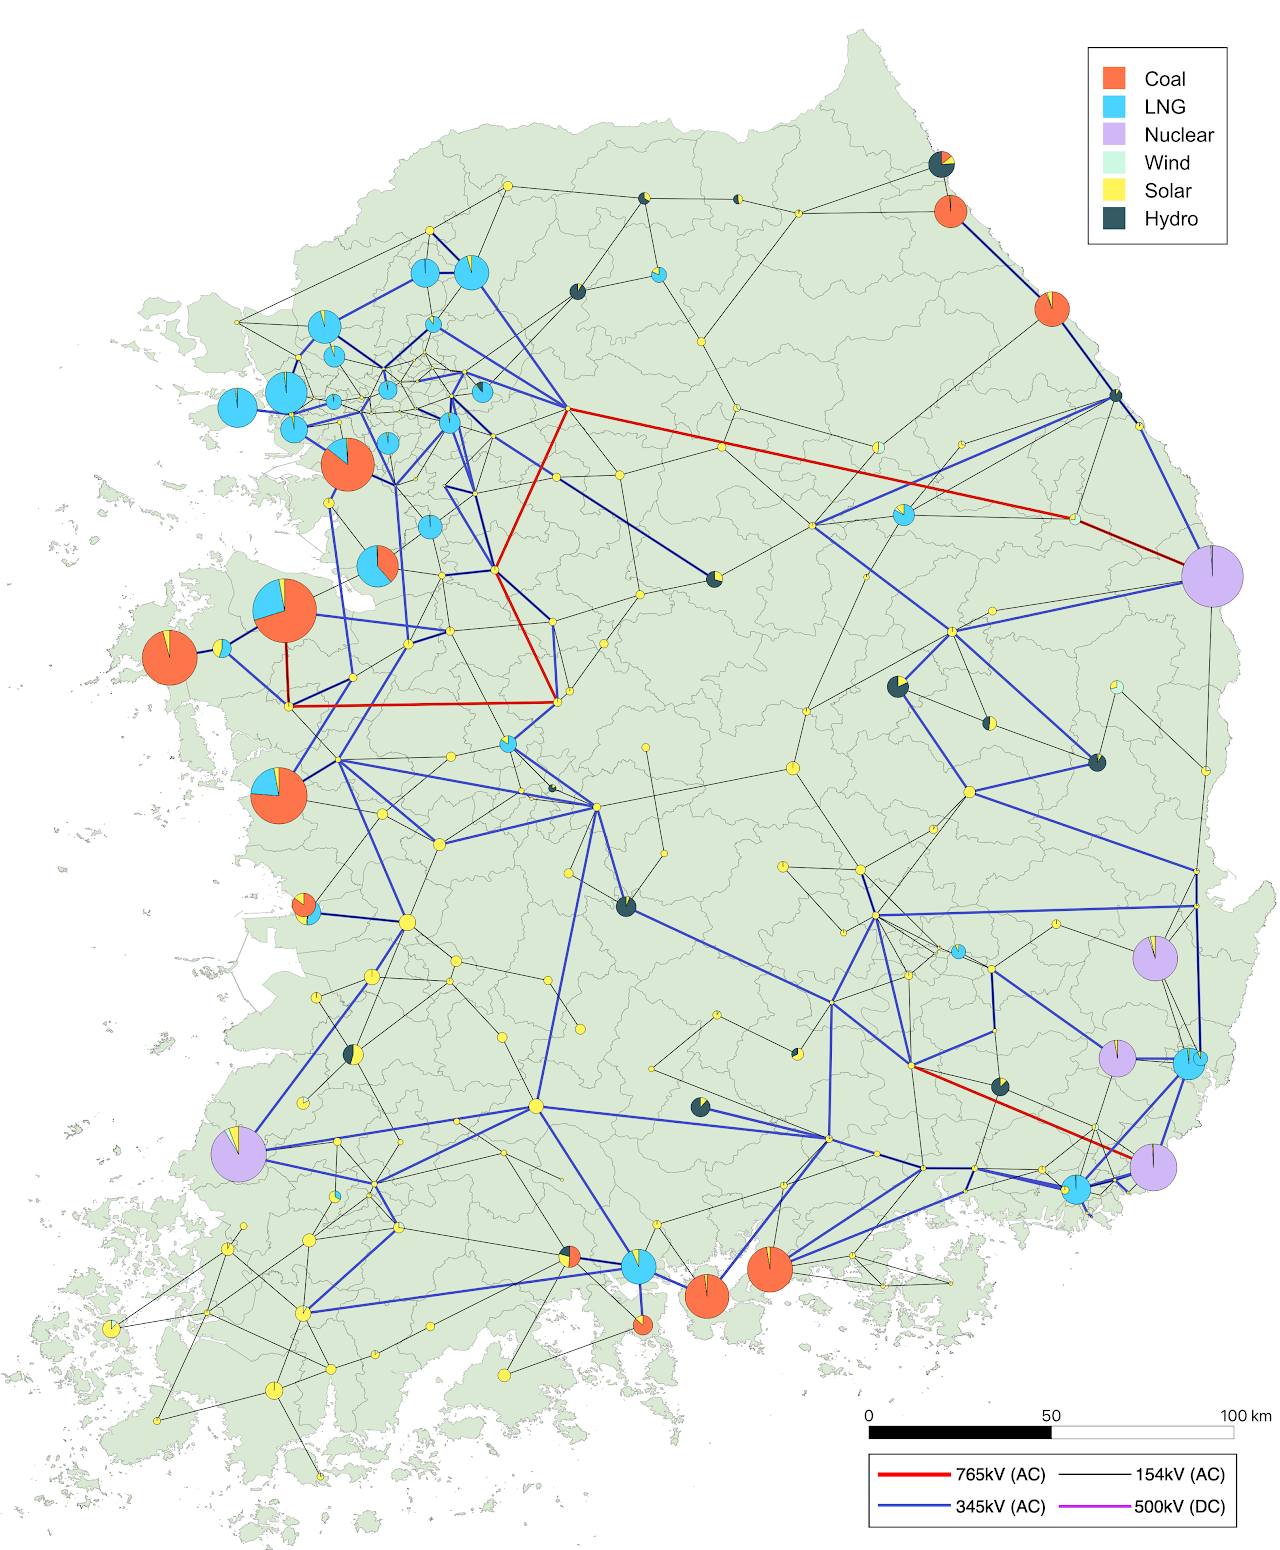
KPG 193 is a synthetic Korean power grid test system representing the Korean transmission network, developed exclusively from open-source data to support power system research and decarbonization studies.
Key Features:
- 193 buses representing substations and load centers across 5 regional areas
- 122 generators including thermal units (Coal, LNG, Nuclear)
- 359 transmission lines across multiple voltage levels (765kV, 345kV, 154kV AC, and 500kV DC)
- 8760-hour profiles providing full-year hourly data for:
- Demand profiles for all buses
- Renewable generation capacity factors (solar, wind, hydro)
- Weather data (temperature, wind speed, longwave flux)
- Reference unit commitment solutions
- MATPOWER-compatible format for easy integration with existing tools
⚡ KPG Run
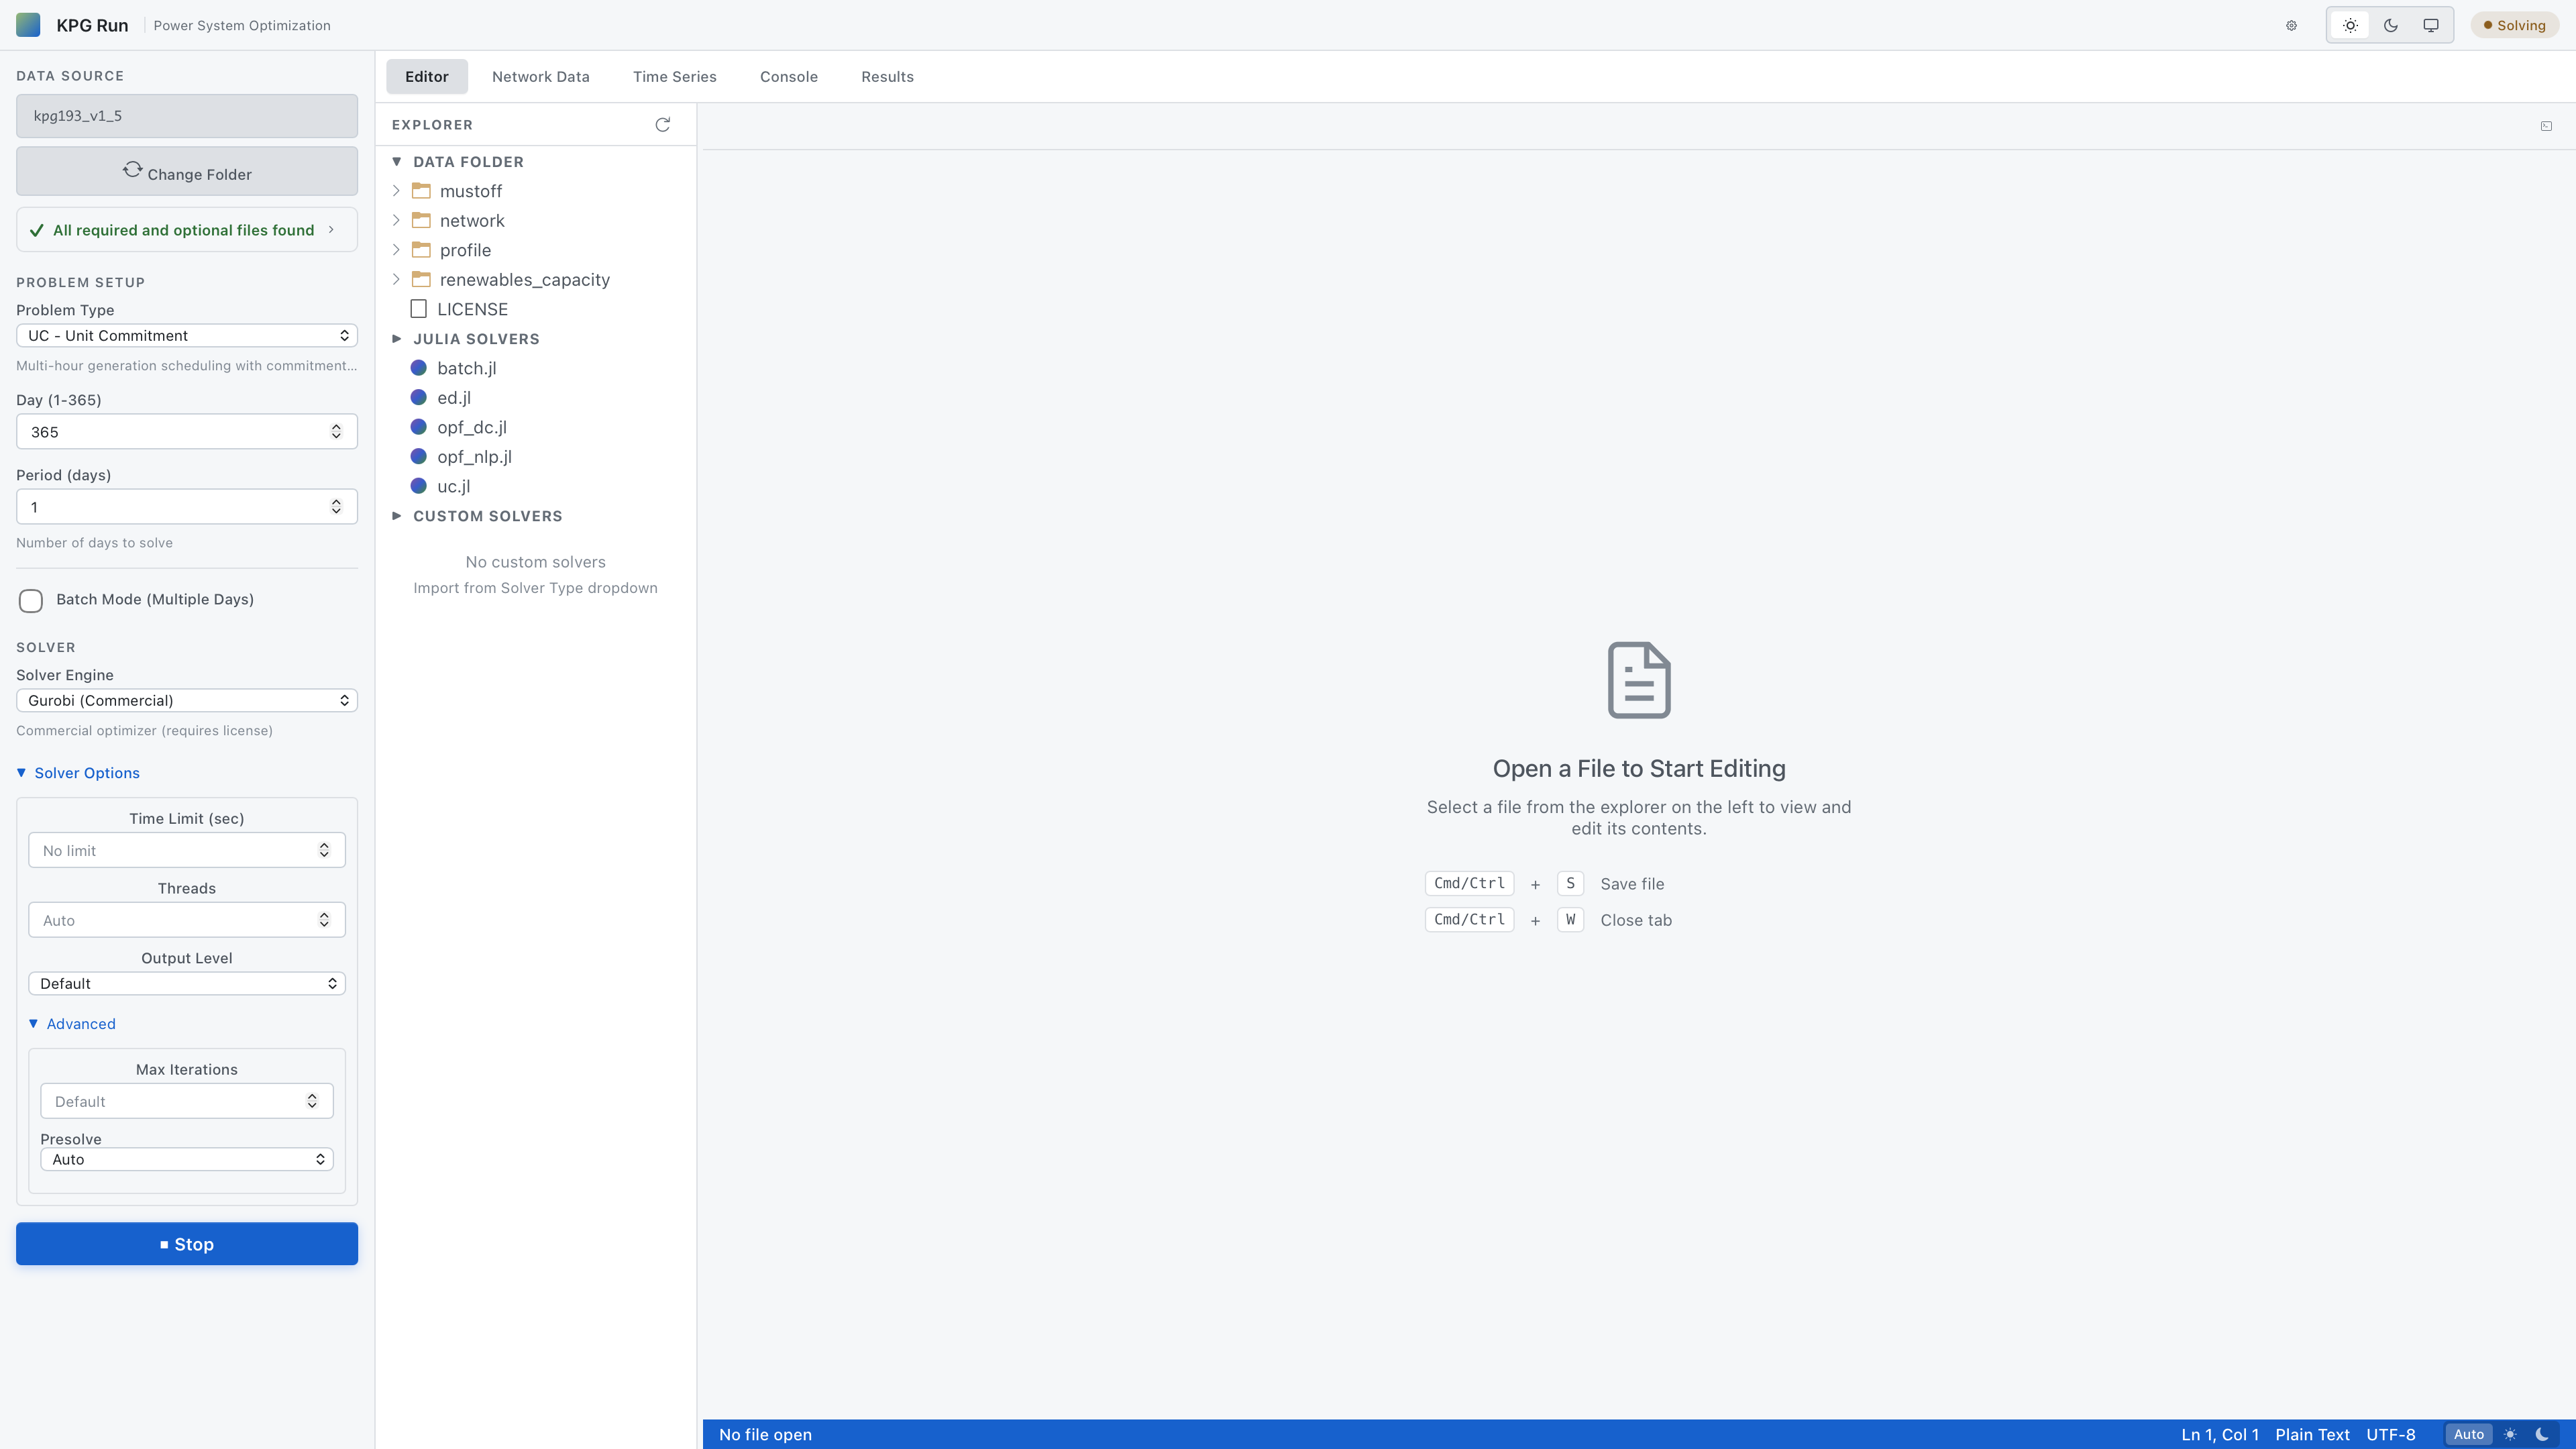
KPG Run is a desktop application that provides an intuitive interface for solving various power system optimization problems.
Available Optimization Models:
-
Economic Dispatch (ED) - Simple cost-minimized generation dispatch without network constraints
-
Unit Commitment (UC) - Scheduling with generator commitment decisions
-
DC Optimal Power Flow (DC-OPF) - Network-constrained dispatch using linearized power flow
-
AC Optimal Power Flow (AC-OPF) - Network-constrained dispatch using full AC power flow
Key Features:
- Real-time solver output streaming
- Built-in data inspection tools
- Result visualization and export
- GeoJSON generation for KPG View integration
📊 KPG View
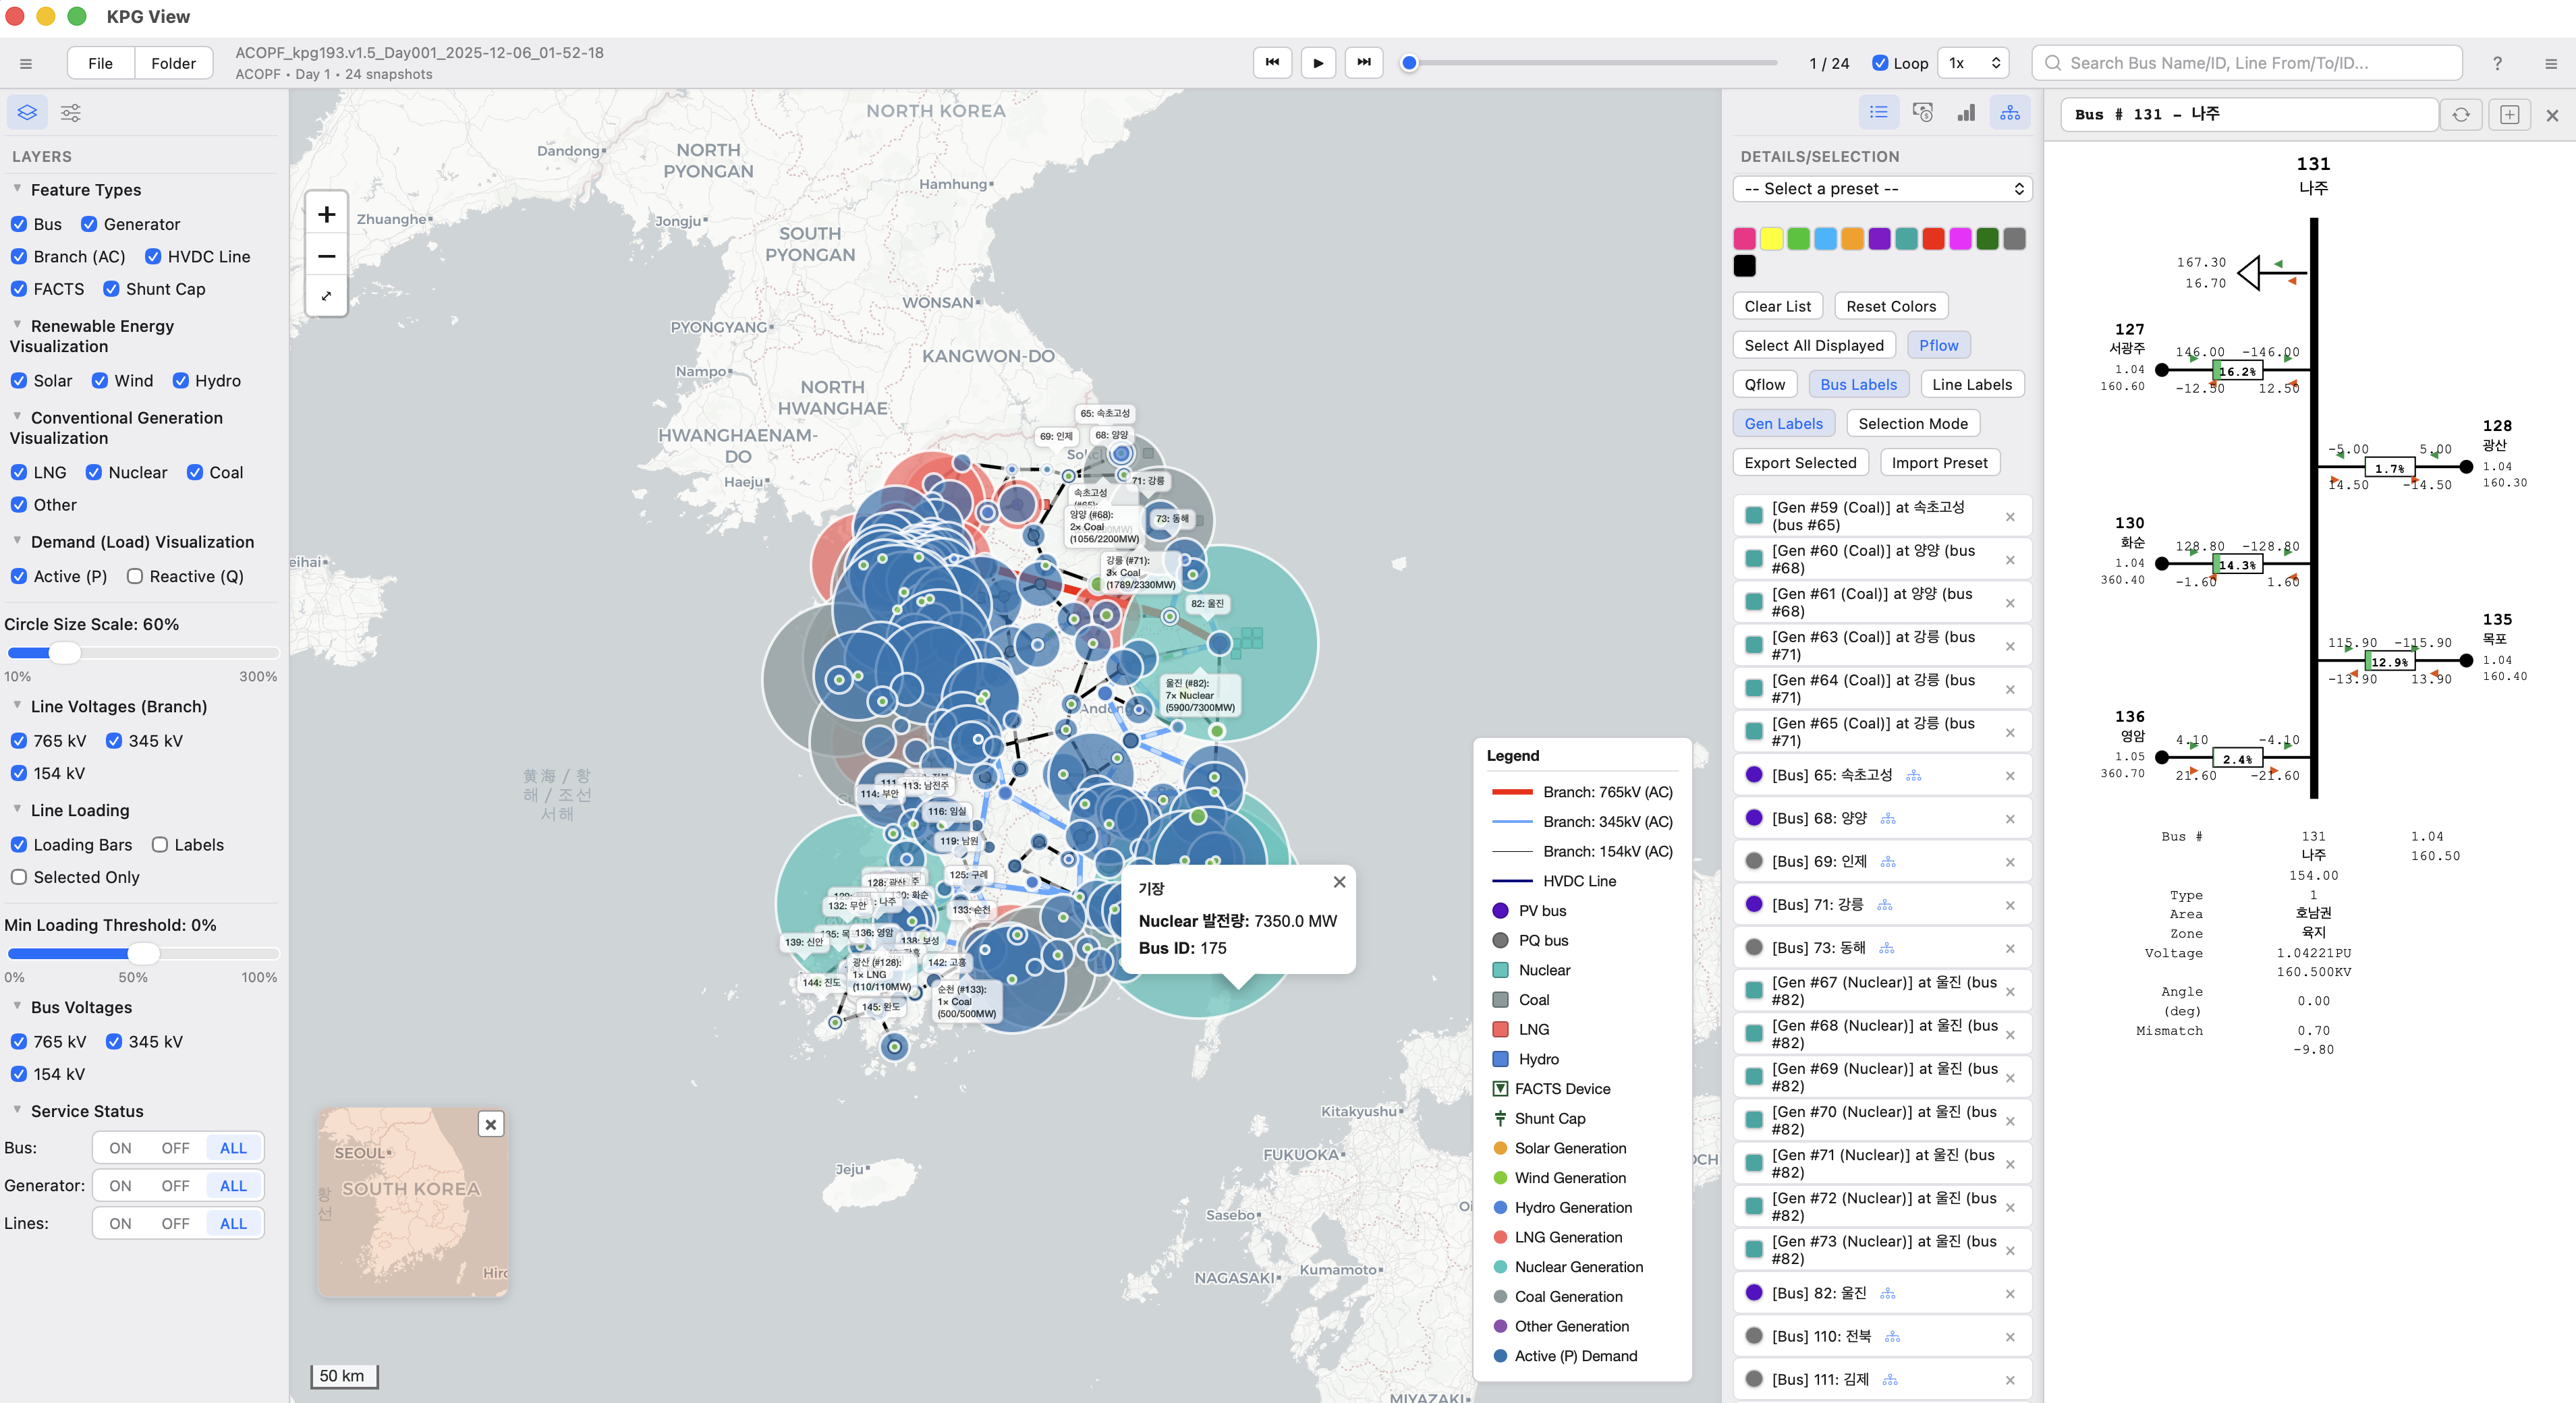
KPG View is an interactive visualization tool for exploring power grid networks and simulation results on a map. It helps you quickly understand where key behaviors happen in the network and compare scenarios.
Capabilities:
- Layer-based visualization: Bus, Generator, Branch (AC), HVDC, FACTS components
- System overlays: Renewable & conventional generation, system load (P/Q), line flows (Pflow/Qflow)
- Filtering & focus: By voltage level (765/345/154 kV), service status (ON/OFF), generator fuel type
- Selection workflow: Search by bus/line IDs, highlight with colors, label components
- Shareable analysis: Presets and export of selected elements for reports
KPG View accepts GeoJSON result files exported from KPG Run, enabling seamless workflow integration from optimization to visualization.
🔍 Who is it for?
The KPG Platform is designed for:
- Researchers exploring grid planning and operation, decarbonization pathways, and renewable integration
- Policy analysts assessing system reliability, economics, and market impacts
- Educators teaching power system optimization and grid analysis
- Developers contributing to open energy models and extending the platform